Ads
![]() Ekta Mourya
Ekta Mourya
FXStreet
Crypto.com announced a list of new trading pairs on its crypto application. Solaba, Shiba Inu and Dogecoin have been added to BUSD pairs on the Crypto.com app.
Also read: Three reasons why Shiba Inu has potential to beat the slump
Crypto.com, a crypto platform and a leading digital asset exchange, put the spotlight on Solana, Shiba Inu and Dogecoin. Crypto.com added BUSD trading pairs for SOL, SHIB, and DOGE, making the cryptocurrencies more accessible.
The addition of new trading pairs could drive the adoption of the three cryptocurrencies among traders on Crypto.com. The exchange has upwards of 50 million users, therefore this increases the exposure and accessibility of SOL, DOGE and SHIB among its application users.
New #BUSD trading pairs are now available in the https://t.co/vCNztATSCO App!
Trade $BUSD with $USDT, $SOL, $SHIB and $DOGE now!
Get the App https://t.co/iIoKFVoiLo pic.twitter.com/X8NSkLc8Wo
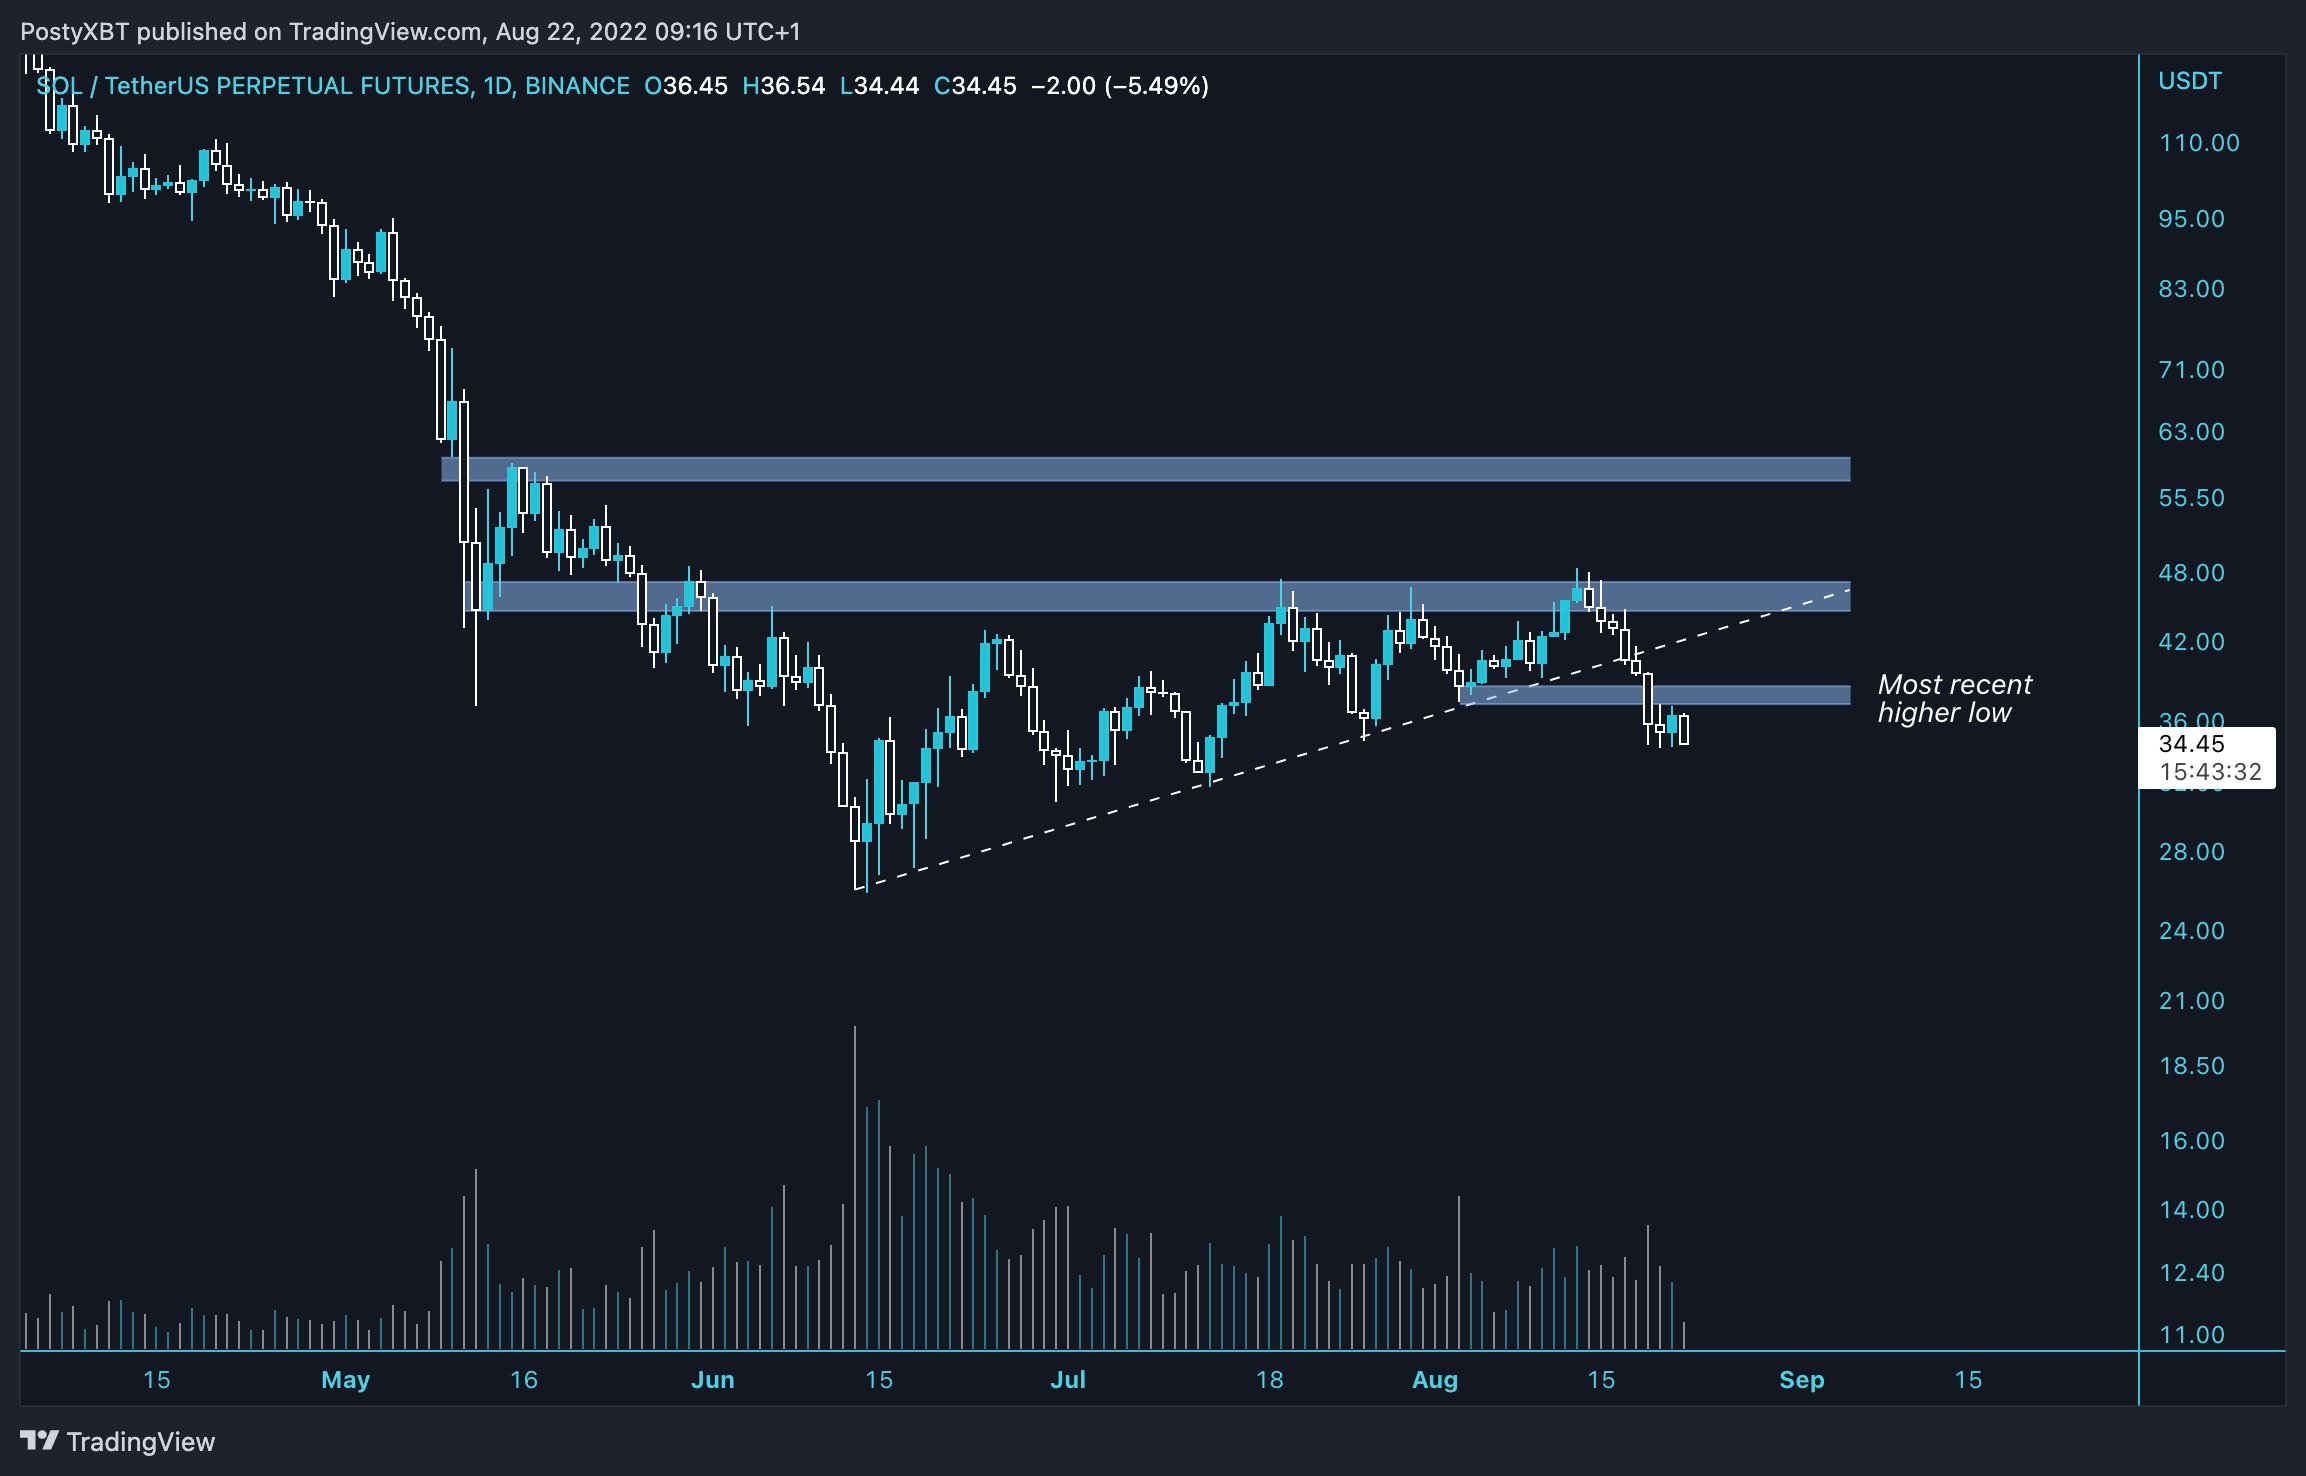
PostyXBT, a pseudonymous crypto analyst, is bullish on Solana. The analyst believes Solana price is ready to recover after climbing to its most recent higher low at $34.50. Solana price structure is not bearish, the analyst believes SOL is ready for recovery.
SOL-USDT Perpetual Futures 1-day price chart
Shiba-Inu-themed meme coins SHIB and DOGE are ready for a comeback after double-digit losses over the past week. Whales have continued accumulating SHIB, and currently hold $163 million worth of Shiba Inu in their portfolio. A spike in whale activity and large value transactions worth $100,000 or more coincides with Shiba Inu and Dogecoin local tops. Therefore, proponents anticipate a recovery in SHIB and DOGE.
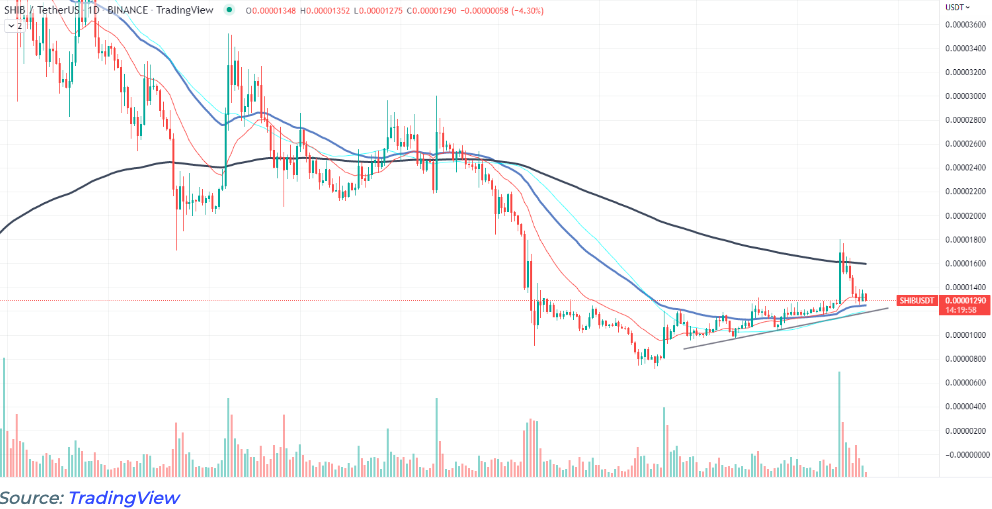
Analysts at UToday argue that Shiba Inu is at a make-or-break point at $0.00001294. Shiba Inu’s next move could determine if the meme coin triggers either an uptrend or a downtrend.
SHIB-USDT price chart
Information on these pages contains forward-looking statements that involve risks and uncertainties. Markets and instruments profiled on this page are for informational purposes only and should not in any way come across as a recommendation to buy or sell in these assets. You should do your own thorough research before making any investment decisions. FXStreet does not in any way guarantee that this information is free from mistakes, errors, or material misstatements. It also does not guarantee that this information is of a timely nature. Investing in Open Markets involves a great deal of risk, including the loss of all or a portion of your investment, as well as emotional distress. All risks, losses and costs associated with investing, including total loss of principal, are your responsibility. The views and opinions expressed in this article are those of the authors and do not necessarily reflect the official policy or position of FXStreet nor its advertisers. The author will not be held responsible for information that is found at the end of links posted on this page.
If not otherwise explicitly mentioned in the body of the article, at the time of writing, the author has no position in any stock mentioned in this article and no business relationship with any company mentioned. The author has not received compensation for writing this article, other than from FXStreet.
FXStreet and the author do not provide personalized recommendations. The author makes no representations as to the accuracy, completeness, or suitability of this information. FXStreet and the author will not be liable for any errors, omissions or any losses, injuries or damages arising from this information and its display or use. Errors and omissions excepted.
The author and FXStreet are not registered investment advisors and nothing in this article is intended to be investment advice.
Bitcoin price is staggering between a rock and a hard place a couple of days after it abandoned the mission to close the gap to $28,000.
Ethereum price remains a beta asset relative to Bitcoin price as it has dropped nearly 8% over the last twelve hours while BTC has slid roughly 4%.
Chainlink (LINK) price is on a rollercoaster move after a very choppy weekend where LINK price looked able to pair back some incurred losses from last week.
Polygon (MATIC) price is on the back foot this morning as equities are taking a step back. Both equity futures in the ASIA PAC session and the handover, the EU and US futures are all pointing to a red painted day, with the VIX index higher.
A period of controlled selling has kick-started and is currently approaching short-term support levels. A minor relief rally might occur – before the next leg down to inefficiencies and liquidity. The current down move has broken significant levels that could trigger a massive sell-off in the future.
Note: All information on this page is subject to change. The use of this website constitutes acceptance of our user agreement. Please read our privacy policy and legal disclaimer.
Trading foreign exchange on margin carries a high level of risk and may not be suitable for all investors. The high degree of leverage can work against you as well as for you. Before deciding to trade foreign exchange you should carefully consider your investment objectives, level of experience and risk appetite. The possibility exists that you could sustain a loss of some or all of your initial investment and therefore you should not invest money that you cannot afford to lose. You should be aware of all the risks associated with foreign exchange trading and seek advice from an independent financial advisor if you have any doubts.
Opinions expressed at FXStreet are those of the individual authors and do not necessarily represent the opinion of FXStreet or its management. FXStreet has not verified the accuracy or basis-in-fact of any claim or statement made by any independent author: errors and Omissions may occur.Any opinions, news, research, analyses, prices or other information contained on this website, by FXStreet, its employees, partners or contributors, is provided as general market commentary and does not constitute investment advice. FXStreet will not accept liability for any loss or damage, including without limitation to, any loss of profit, which may arise directly or indirectly from use of or reliance on such information.
Ads
Ads

