The Shiba Inu price analysis for today is slightly bearish since the market is currently in a downtrend with no indication of the bulls catching up.

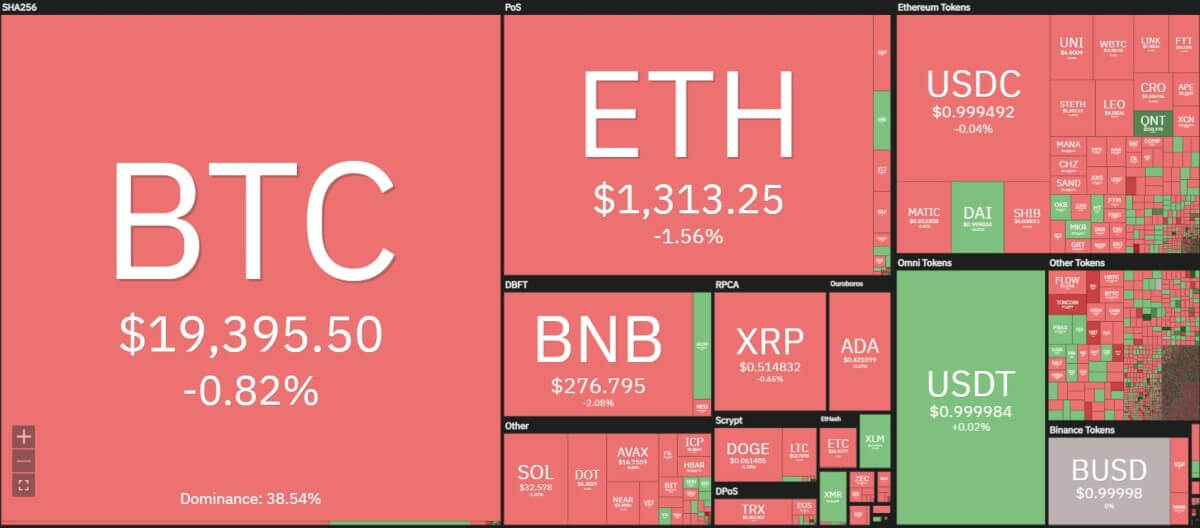
As the crypto heat map shows, both Ethereum and Bitcoin are down by 1.56 percent and 0.82 percent, respectively. The other altcoins are also following both the major coins.

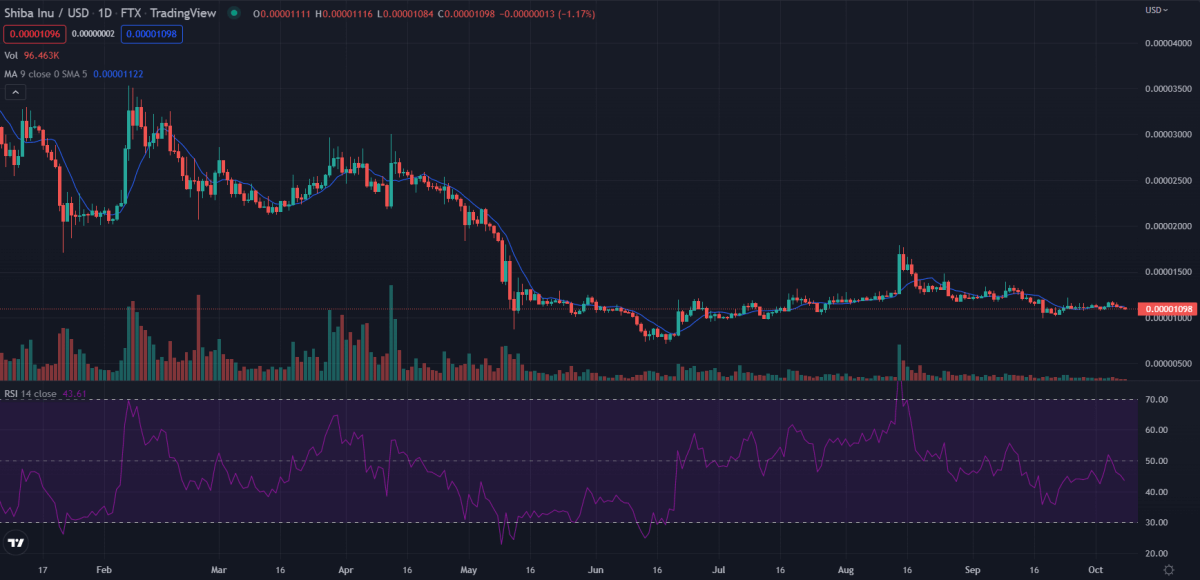
The 1-day Shiba Inu price analysis shows us how down the token has gone since the start of the year. However, Shiba Inu has consistently traded in a range over the last few days. Could this be the formation of a bottom? As always, traders are advised not to time the bottom and try to DCA (dollar cost average) their investment.
As of now, the RSI levels of Shiba Inu seem quite balanced on the 1-day chart. So, there is no indication of a major sell-off. Nevertheless, the bullish momentum is simply non-existent. It looks like the bears are in full force right now and might even succeed in causing another dip to the previous major support line of $0.00000976.
Shiba Inu 24-hour price movement

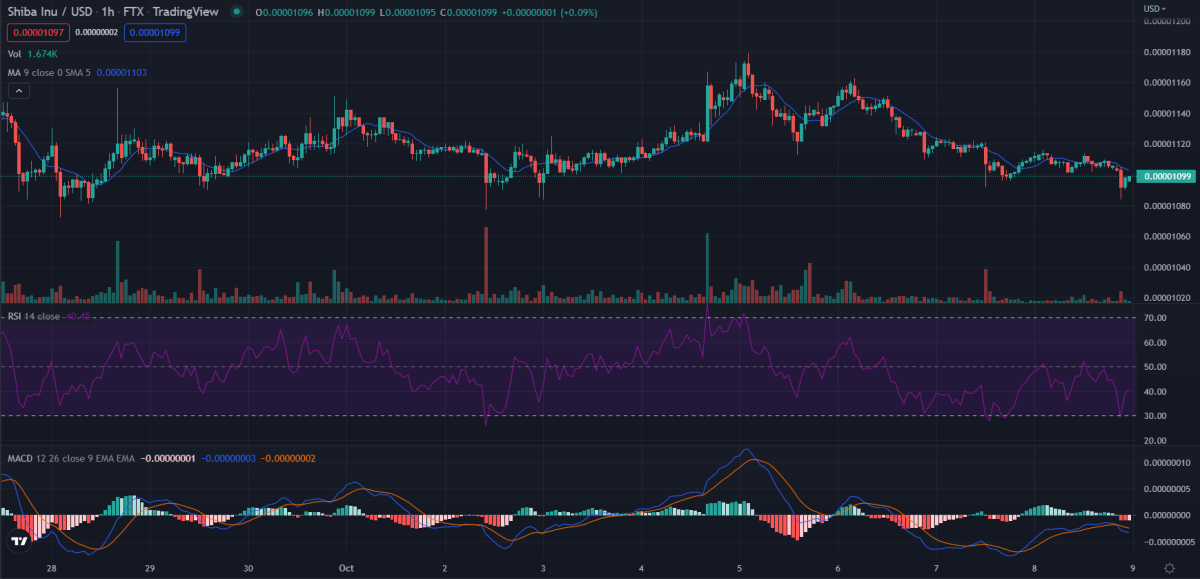
The 1-hour price analysis of Shiba Inu shows that the token went through a dip two hours ago, as the price reached a low of $0.00001084 but quickly recovered back to the current price of $0.00001099.
Shiba Inu is among the few tokens that are quite volatile, as the dips tend to be sharp. Although, the price change itself is not too high.
The RSI level is currently at 41 after a quick recovery from 29. The MACD further gives us indications that the bearish momentum has not fully vanished yet. For the most part, Shiba Inu continues to trade in the reds. Furthermore, we can see a downtrend forming on the 1-day Shiba Inu price analysis.
Could there be more room for a dip? Shiba Inu’s support is currently set around the $0.00001084 mark, and if that gets broken, then there could be a possibility of a further downside. For now, the bearish momentum is only trying to pull SHIB/USD down.
Based on daily chart data, the market cap of Shiba Inu is down by 0.77 percent, while the trading volume went up by 43.77 percent, leaving its volume-to-market cap ratio at 0.01509.
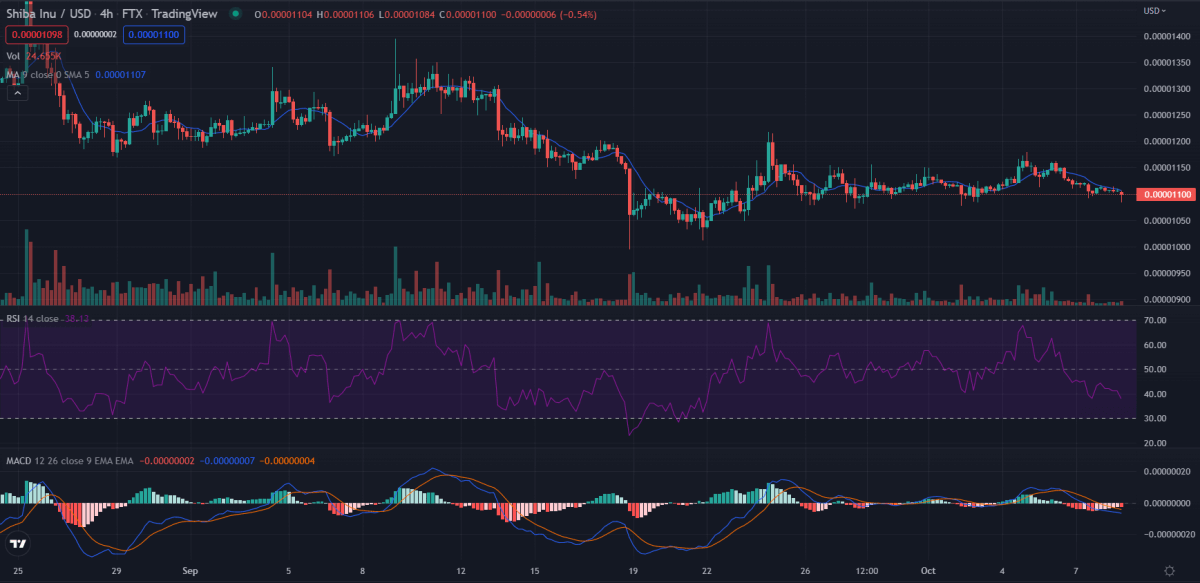
4-hour Shiba Inu price analysis: Bearish momentum is still very strong

The bearish momentum still seems very strong for Shiba Inu. The 4-hour Shiba Inu price analysis does not give any positive indications either. For now, the market is extremely uncertain and leaning more toward the negative side. Shiba Inu will likely try to retest the support line in the next 24 hours.
Shiba Inu price analysis: Conclusion
Based on all the indications given by the daily, hourly, and 4-hour charts, it is certain that the bulls are completely exhausted by the momentum. The bears are consistently pulling the price down in the short term. We can see that Shiba Inu is consolidating sideways on the long-term timeframes. In the meantime, consider reading our list of the top 10 cryptocurrencies to buy right now.
Disclaimer. The information provided is not trading advice. Cryptopolitan.com holds no liability for any investments made based on the information provided on this page. We strongly recommend independent research and/or consultation with a qualified professional before making any investment decisions.