Bitcoin Analysis
With Bitcoin’s fourth halving an estimated 558 days or 86,931 blocks away yet, what can we expect over the last 113 days of 2022 and moving forward to 2023? Nobody can know for certain but by focusing on Bitcoin’s charts, different timescales, and the technicals, we can attempt to predict what’s forthcoming for BTC’s price and ergo market participants across the cryptocurrency sector.
BTC’s price finished up greater than 2% for Wednesday’s daily session following Tuesday’s daily candle where BTC’s price sold-off by more than $1,000. Bitcoin’s price finished-up Wednesday’s daily candle +$499.1.
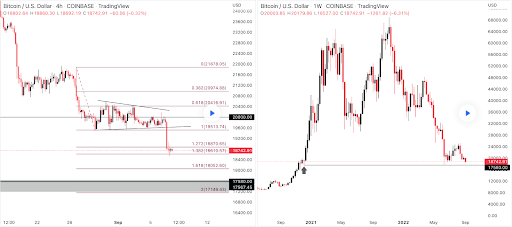
The first chart we’re looking at for this Thursday is the BTC/USD 4HR chart below on the left. The 4HR chart and the BTC/USD 1W chart are both from DannyC914. BTC’s price is trading between the 1.272 fibonacci level [$18,870.65] and 1 fib level [$19,513.74], at the time of writing.
Despite obvious bearish momentum again, BTC bulls are hoping to stop the bleeding before a new 12-month low is made below $17,611. The targets overhead for bullish BTC market participants are 1, 0.618 [$20,416.91], 0.382 [$20,974.88], and a full retracement to 0 [$21,878.05].
Conversely, bearish BTC traders are seeking to break the 1.272 fib level with a secondary target of 1.382 [$18,610.57]. The third target to the downside for bearish traders is 1.618 [$18,052.60] with a fourth target of 2 [$17,149.43].

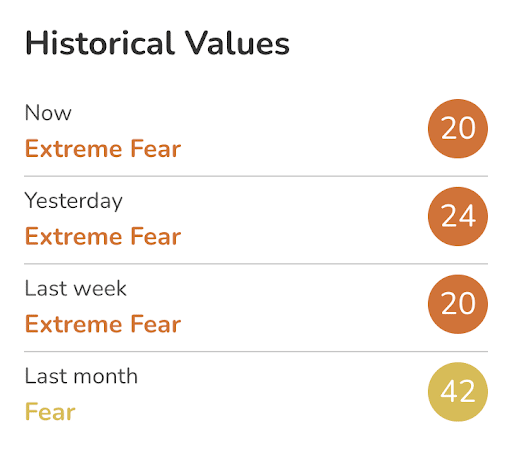
The Fear and Greed Index is 20 Extreme Fear and is -4 from Wednesday’s reading of 24 Extreme Fear.

Bitcoin’s Moving Averages: 5-Day [$19,532.15], 20-Day [$21,459.85], 50-Day [$21,725.96], 100-Day [$25,722.3], 200-Day [$34,478.93], Year to Date [$32,654.04].
BTC’s 24 hour price range is $18,549-$19,463 and its 7 day price range is $18,549-$20,385. Bitcoin’s 52 week price range is $17,611-$69,044.
The price of bitcoin on this date last year was $46,051.4.
The average price of BTC for the last 30 days is $21,676.5 and its -18.9% over the same period.
Bitcoin’s price [+2.66%] closed its daily candle worth $19,285.2 on Wednesday and back in green figures after starting off the week with consecutive days in red digits.
Ethereum Analysis
Ether’s price closed its day nearly 5% up from its session’s open and when traders settled-up on Wednesday, ETH’s price was +$71.73.
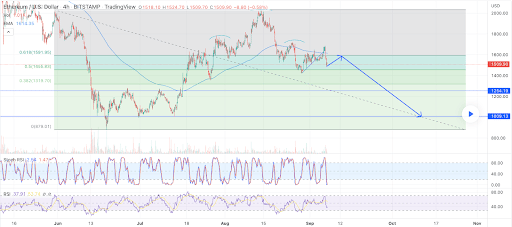
Today’s second chart for analysis is the ETH/USD 4HR chart below by jorismv. ETH’s price is trading between 0.5 [$1,455.83] and 0.618 [$1,591.95], at the time of writing.
We can see that Ether’s price has held the 0.5 thus far despite being tested and bulls are hoping to again reclaim territory above the 0.618 fib level.
From the bearish perspective, they’re still short ETH and have targets of 0.5, 0.382 [$1,319.70], and a full retracement at 0 [$879.01].

Ether’s Moving Averages: 5-Day [$1,575.19], 20-Day [$1,688.36], 50-Day [$1,533.24], 100-Day [$1,744.01], 200-Day [$2,478.17], Year to Date [$2,285.90].
ETH’s 24 hour price range is $1,490.66-$1,657.5 and its 7 day price range is $1,502.29-$1,670.67. Ether’s 52 week price range is $883.62-$4,878.
The price of ETH on this date in 2021 was $3,499.27.
The average price of ETH for the last 30 days is $1,680.64 and its -11.07% over the same duration.
Ether’s price [+4.60%] closed its daily candle on Wednesday worth $1,629.57 and in green figures for the third time over the last four days.
Shiba Inu Analysis
Shiba Inu’s price also bounced back on Wednesday as Bitcoin’s bullish tide rose most ships across the cryptocurrency sector and when the day’s session wrapped-up, SHIB’s price was +$0.00000024.
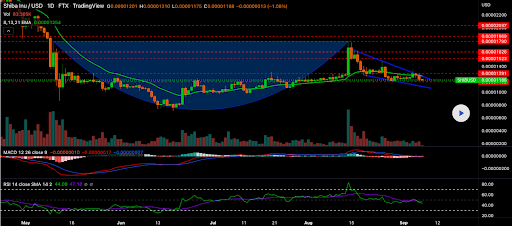
The SHIB/USD 1D chart below from DarthTrador shows SHIBS’s price trying to break out of a Falling Wedge that looks to be part of a larger Cup with Handle Pattern.
If bullish traders can break out at $0.00001278 then there’s a chance to see a short-term retracement to the upside on SHIB.
However, if bearish traders defend the top of its current structure than new local lows on SHIB’s price may be forthcoming.

SHIB’s Moving Averages: 5-Day [$0.000012], 20-Day [$0.000013], 50-Say [$0.000012], 100-Day [$0.000013], 200-Day [N/A], Year to Date [$0.000018].
Shiba Inu’s price is +102% against The U.S. Dollar over the last 12 months, +398.1% against BTC, and +343.6% against ETH, over the same period.
Shiba Inu’s 24 hour price range is 0.00001174-0.00001239 and its 7 day price range is $0.00001174-$0.00001239. SHIB’s 52 week price range is 0.00000544-0.0000884.
Shiba Inu’s price on this date last year was $0.00000668.
The average price of SHIB over the last 30 days is $0.00001294 and its even for the same time frame.
Shiba Inu’s price [+2.09%] closed its daily session on Wednesday worth 0.00001225 and in green figures for the first time in three days.