Polkadot price analysis is showing a bullish trend, with the price of DOT/USD rising from $5.73 to $6.12 in the past 24 hours, representing an increase of 5.25 percent. This is possibly due to the market recovering after a few days of stagnation and investors opening up more positions for DOT.
The current support level for Polkadot lies at around $5.73, and any further dip from this point will only be temporary. The bulls are currently trying to push above the resistance mark at $6.21, but they have failed so far as traders remain cautious about investing in Polkadot during these uncertain times. However, if buyers successfully manage to break past this resistance level, then it could signal a major uptrend in DOT’s price, which could lead to it reaching as high as $6.30 in the next few days.
Polkadot price analysis on 1-day chart: Bulls lead the DOT/USD pair after a recent bullish run
The 24-hour chart of Polkadot is currently showing a slightly bullish trend as the bulls are leading the DOT/USD pair after a recent surge in price. The market opened today, trading in a bullish trend, and is currently trading at $6.12 after a quick recovery from the bottom of $5.73. The bearish pressure is still present as the bears are trying to push the price down, but buyers remain in control and are managing to keep the price above the support level.

Looking ahead, the technical indicators are suggesting that the bulls have a strong grip on the market and should be able to push DOT/USD above $6.21, which could signal further bullish momentum in the near future. The moving average indicator is currently showing a bullish pattern, and the relative strength index (RSI) is also in the overbought zone, suggesting that buyers are in control. The MACD indicator is currently in positive territory, the histogram is above the signal line, and the MACD line is also trading in positive territory.
Polkadot price analysis: DOT continues to show bullish potential at $6.12
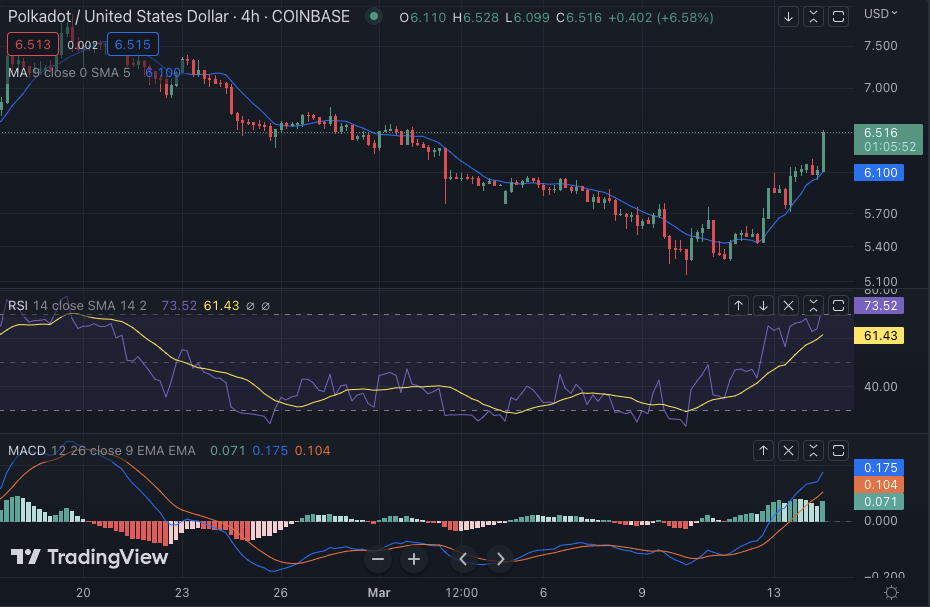
The 4-hour Polkadot price analysis is showing signs of considerable recovery as the price climbed up to $6.12. The bulls have been ruling continuously, which is why the uptrend has been quite stable. The bullish pattern is also suggesting that the next target for DOT/USD is likely to be around $6.21, which could potentially lead to further gains in the coming days.

The moving average value has increased to $6.10 as well because of the constant rise in price. There has been a crossover between SMA 20 and SMA 50 curves in the previous hours, which is also a huge bullish sign. The RSI has also been on the rise, pushing past the overbought region, and is currently at 73.52 – another sign of a bullish trend. In addition to this, the MACD histogram is in green in the positive region, and the MACD line is trading above the signal line.
Polkadot price analysis conclusion
Overall, Polkadot price analysis shows that the bulls are in control and are continuing to push DOT/USD higher. The technical indicators are also suggesting that a strong uptrend is on its way, with the possibility of DOT reaching up to $6.21 in the next few days. However, it is important to remember that the market remains volatile, and any sudden changes could affect the price movements.