- Shiba Inu maintains its strongly bullish long-term outlook
- The current retracement could take a while to resolve, and the golden pocket is a key area of interest for the bulls
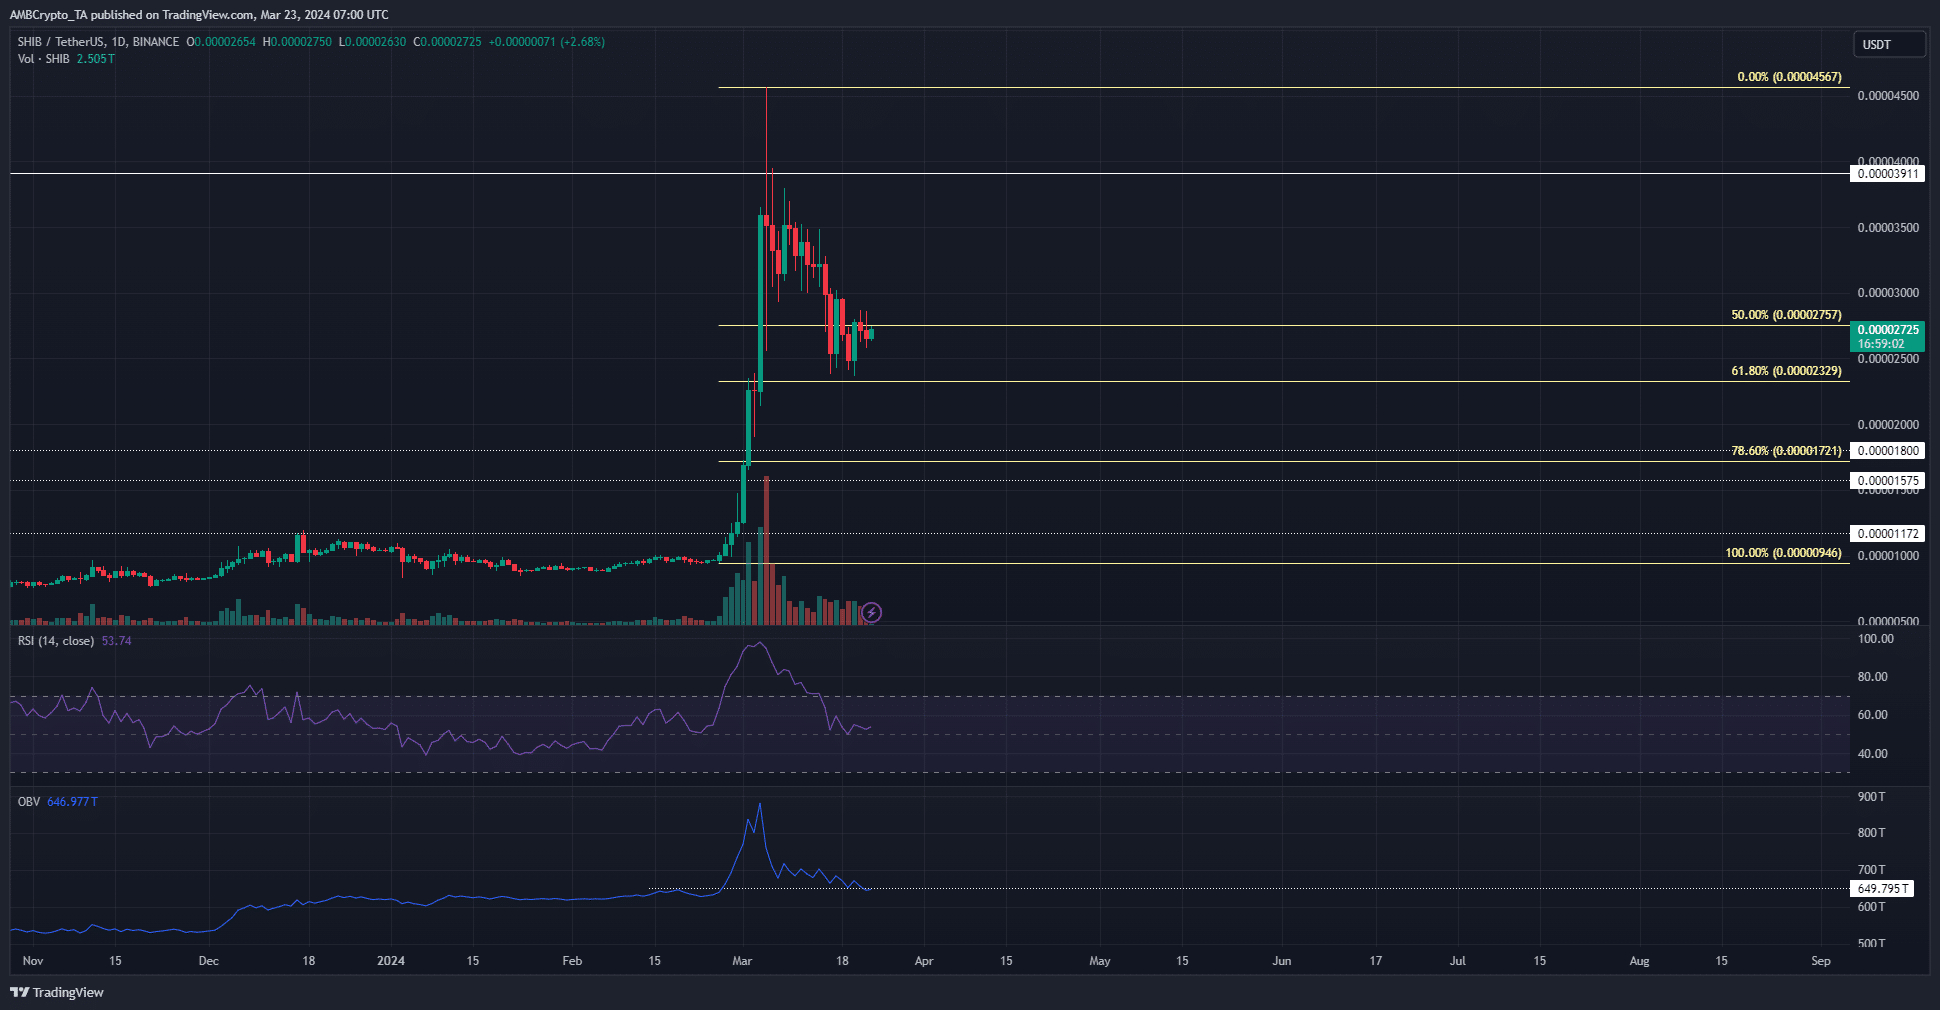
Shiba Inu [SHIB] fell from the local high of $0.00004567 to trade at $0.00002725 at press time. This represented a 40% drop over eighteen days. The retracement could go deeper, based on technical analysis.
Whales took profit during the recent rally while tiny holders continued to load up on the memecoin. This behavior from whales was another factor that pointed toward a continuation of the current dip.
The retracement has not ended yet
The market structure of SHIB in the 1-day timeframe remained bullish. The recent swing low remained at $0.00000946. It could take some time for a new, higher swing low to be established.
The RSI was also above neutral 50, supporting the bullish idea. However, the reading of 53.74 showed that the momentum has drastically slowed down in the past few days. The selling pressure was also slowly winning.
This was inferred from the OBV, which was back at a former resistance level despite the huge recent rally. The Fibonacci retracement levels (pale yellow) still underlined key support levels that SHIB prices could revisit.
On-chain metrics point toward a consolidation phase

Source: Santiment
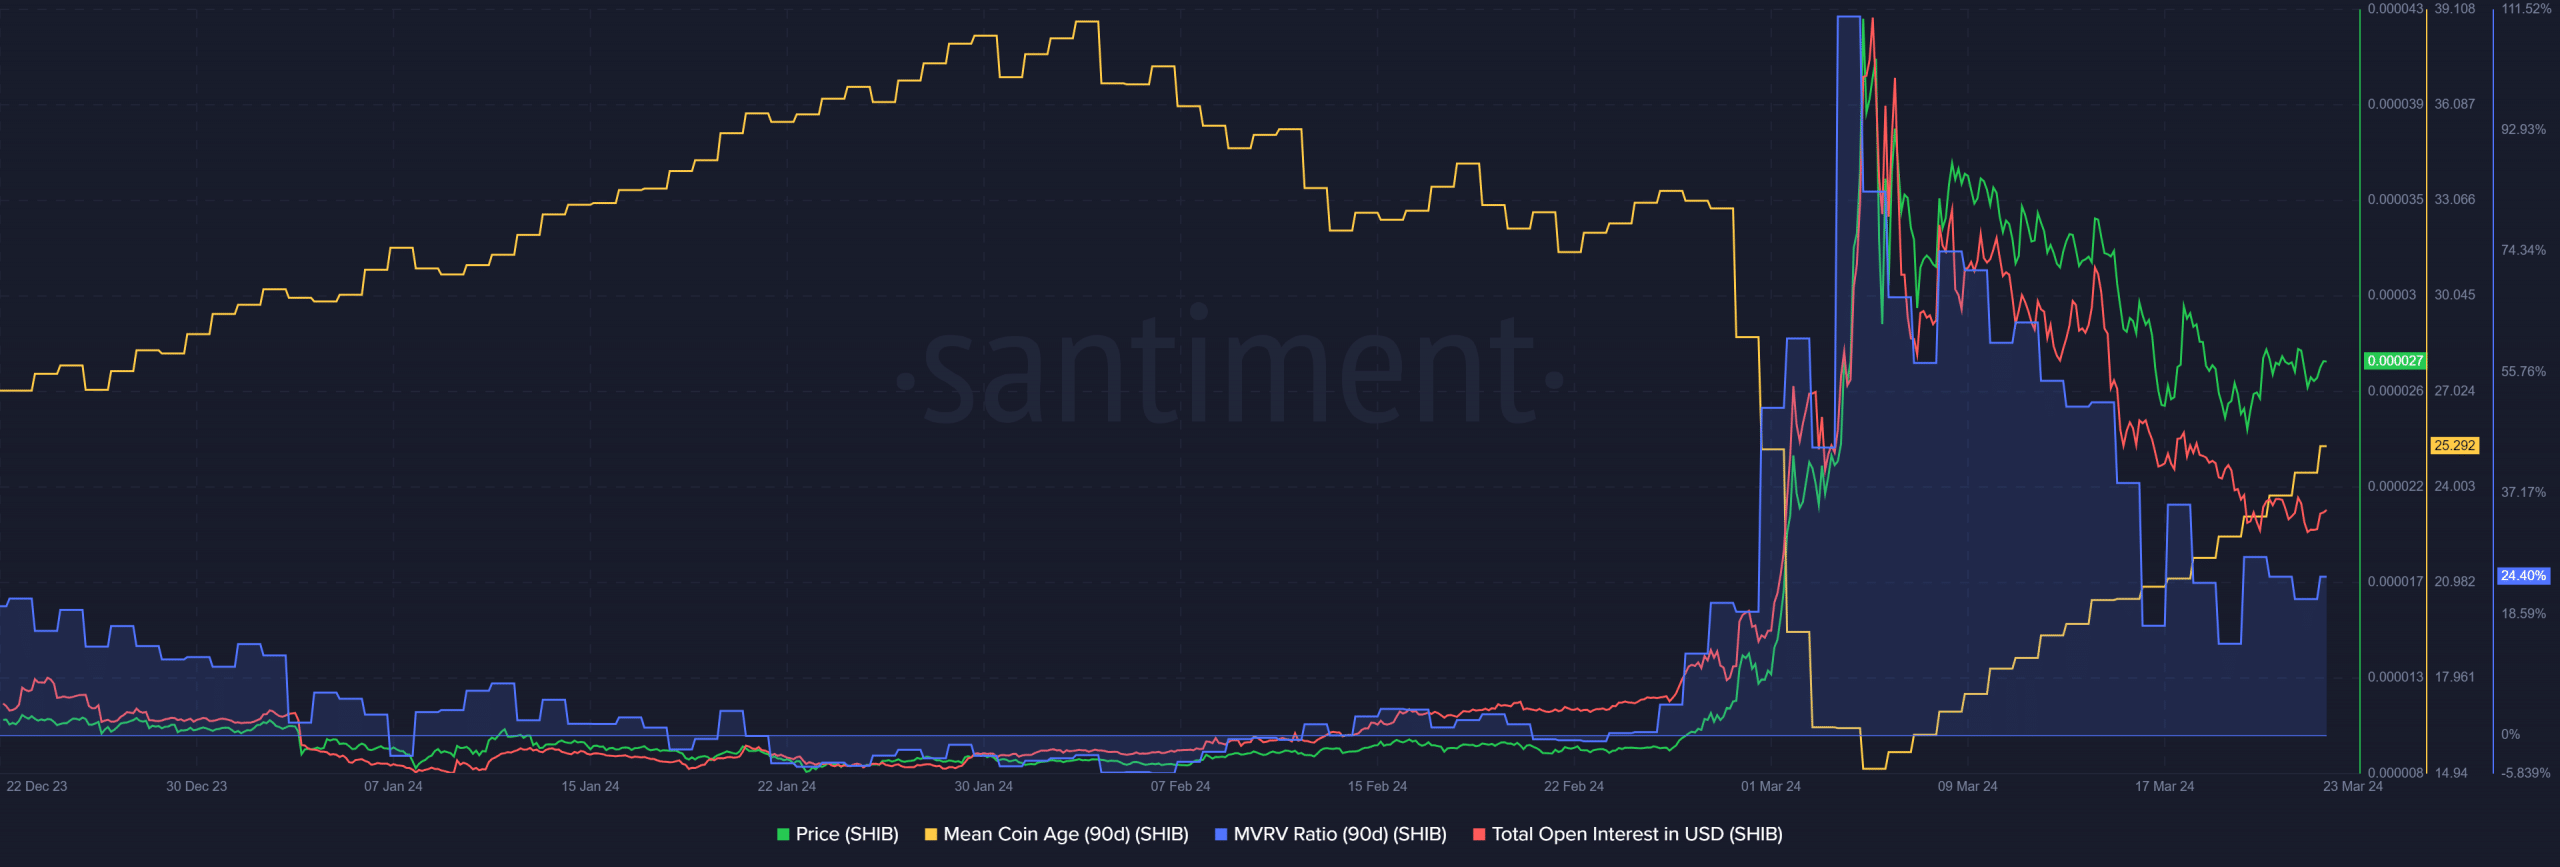
As prices fell lower, so did the Open Interest behind SHIB. This indicated that speculators were unwilling to bet on the memecoin and preferred to remain sidelined. Alongside this, the mean coin age has been climbing over the past two weeks.
It showed an accumulation of Shiba Inu across the network. While the price saw a short-term downtrend or retracement, holders were already preparing for the next rally. This was an encouraging sign.
How much are 1, 10, or 100 SHIB worth today?
The MVRV still had a high positive reading despite the recent downtrend. A good chunk of holders were still in profit, but the profit-taking selling pressure has likely subsided.
Overall, it appeared likely that SHIB would slowly drop toward the Fibonacci golden pocket. It could then form a range within that region before blasting off or could see a strong bullish reaction quickly after the retest of the demand zone.
Disclaimer: The information presented does not constitute financial, investment, trading, or other types of advice and is solely the writer’s opinion.
